Devices that launch on Android 12 and higher
utilize mm_events, a set of memory-related statistics that get captured
periodically while a system experiences memory pressure. mm_events is
integrated with perfetto tracing mechanisms, and because it’s activated only
when memory pressure is detected, its added performance overhead is minimal. The
statistics collection starts when the kernel's kswapd, direct reclaim, or
compaction mechanisms get activated, and it stays active for a configurable
period of time
to capture statistics at regular intervals.
Instead of providing a one-time snapshot of the system memory state when a bug
report is filed, mm_events shows a brief historical view of the memory
statistics during periods of memory pressure. The captured statistics are listed
in the following tables.
vmstat fields
nr_free_pages | nr_slab_reclaimable |
nr_slab_unreclaimable | nr_active_file |
nr_inactive_file | nr_active_anon |
nr_inactive_anon | workingset_refault |
workingset_activate | nr_file_pages |
pgpgin | pgpgout |
pswpin | pswpout |
pgsteal_kswapd_dma | pgsteal_kswapd_normal |
pgsteal_kswapd_movable | pgsteal_direct_dma |
pgsteal_direct_normal | pgsteal_direct_movable |
pgscan_kswapd_dma | pgscan_kswapd_normal |
pgscan_kswapd_movable | pgscan_direct_dma |
pgscan_direct_normal | pgscan_direct_movable |
compact_migrate_scanned | compact_free_scanned |
mm-related trace events
vmscan/mm_vmscan_kswapd_wake | vmscan/mm_vmscan_kswapd_sleep |
vmscan/mm_vmscan_direct_reclaim_begin | vmscan/mm_vmscan_direct_reclaim_end |
compaction/mm_compaction_begin | compaction/mm_compaction_end |
Analyze mm_events data
If mm_events is enabled, the bug reports for the events that get captured soon
after a device begins to experience high memory pressure provide the historical
mm_events stats, in the form of a zipped report in
FS/data/misc/perfetto-traces/bugreport/systrace.pftrace.
Both the vmstat data and ftrace events can be viewed for analysis using the
Perfetto UI.
vmstat data
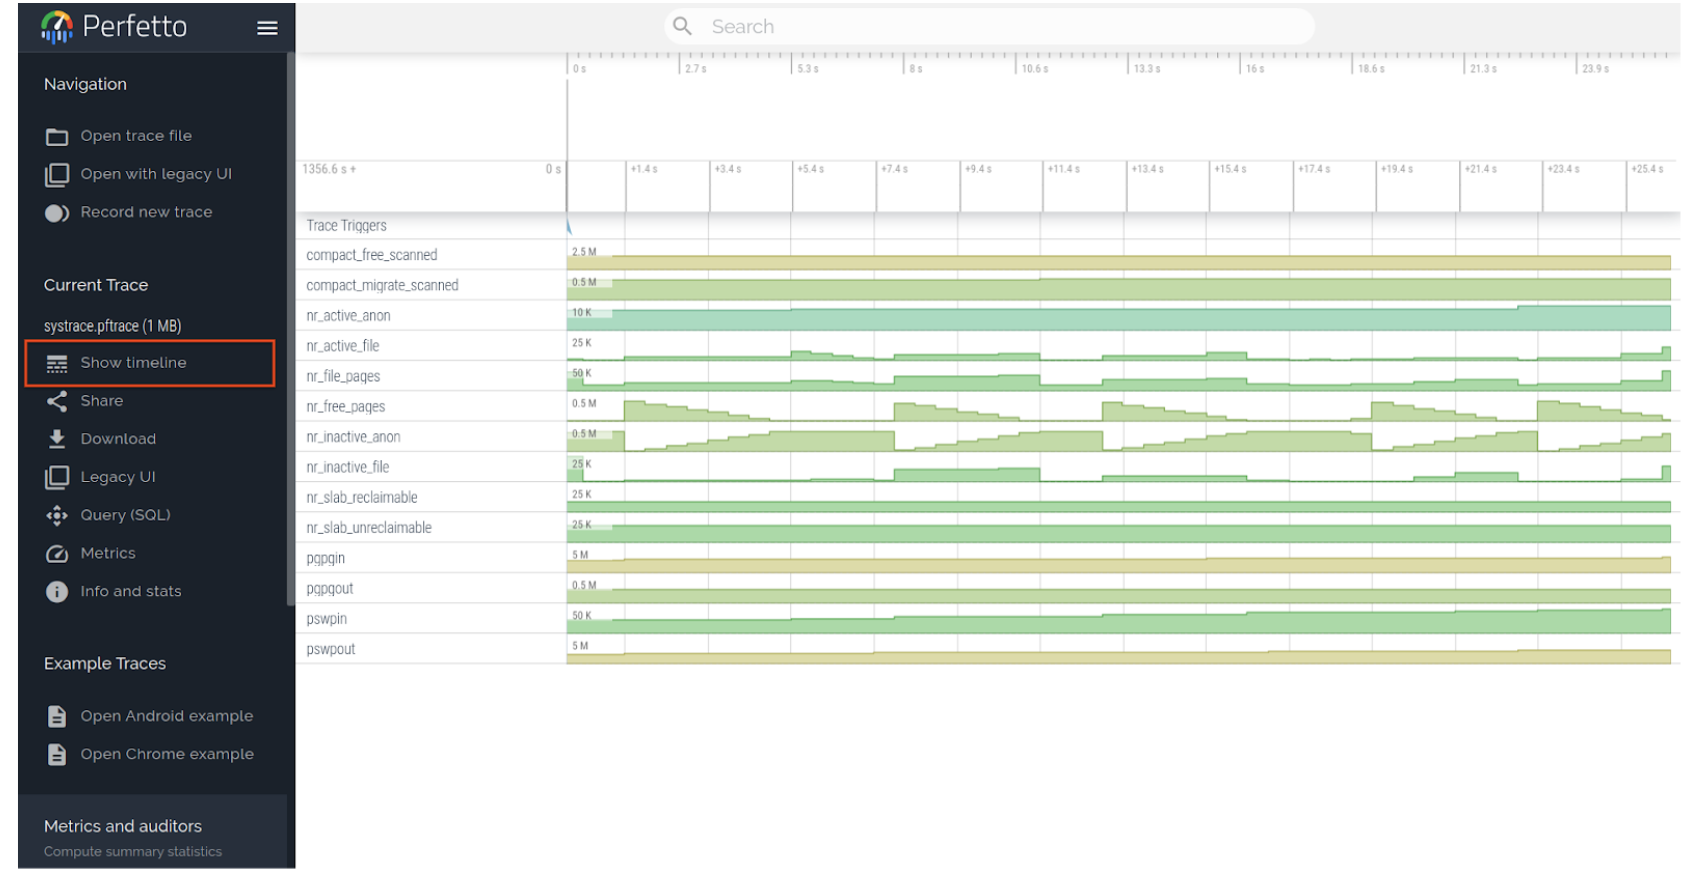
Upload the systrace.pftrace file to Perfetto UI to see the vmstat data
graphed on a timeline as shown in Figure 1:

Figure 1. Timeline of vmstat graphical data.
ftrace events
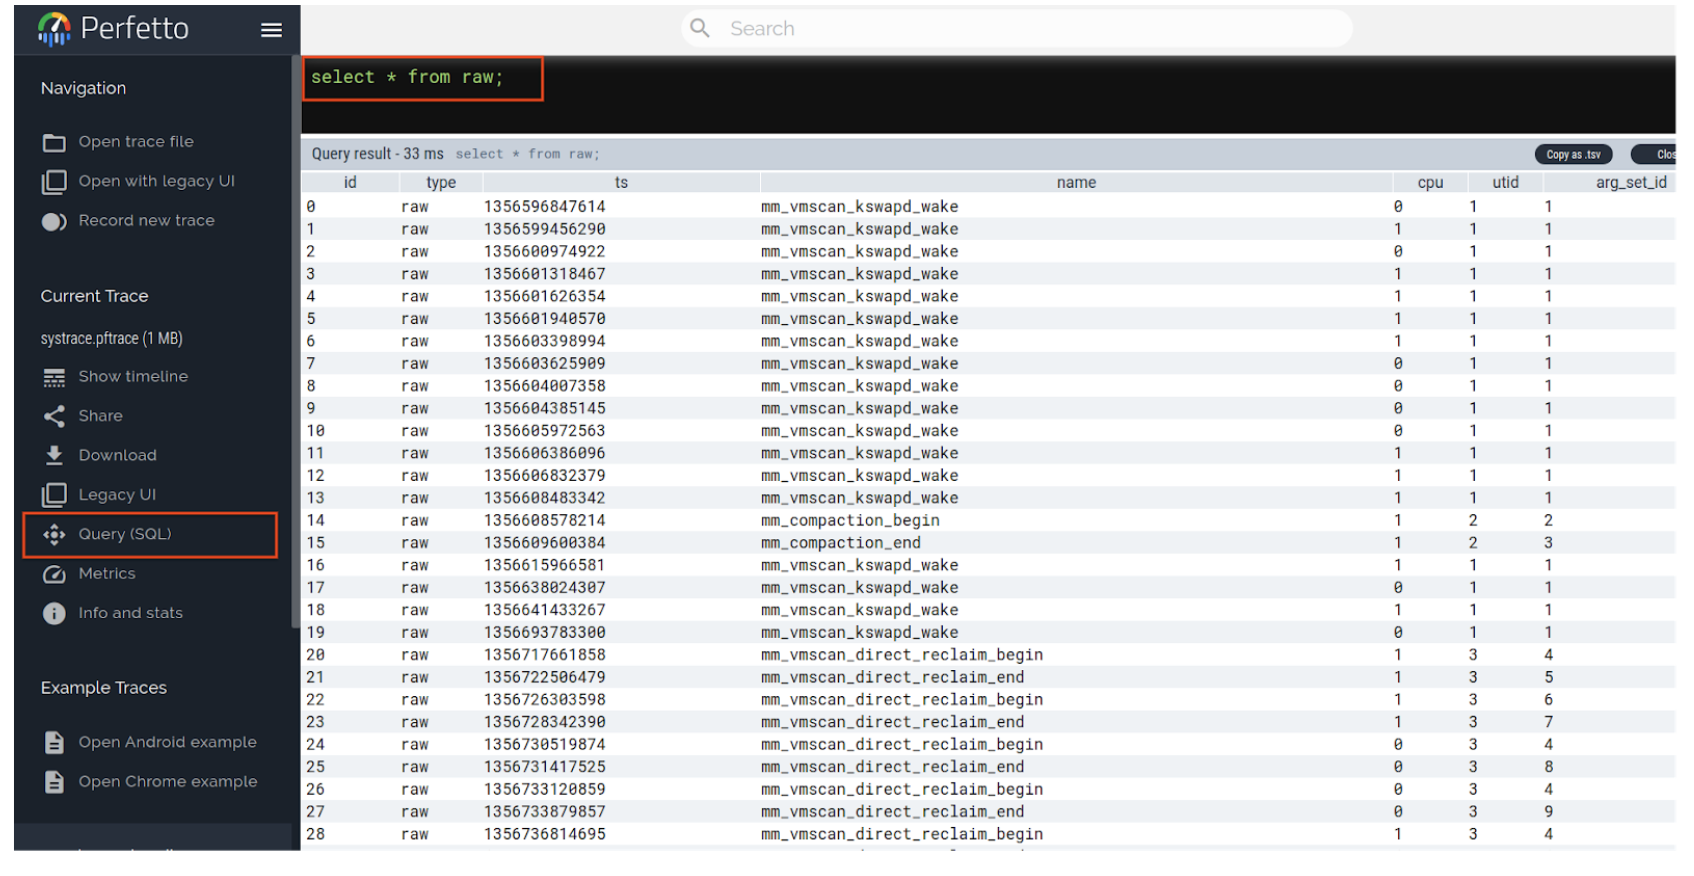
The captured ftrace mm_events aren't shown graphically on the timeline. To
view them, click the Query SQL tab, located as shown in Figure 2:

Figure 2. Click Query (SQL) to access.
Enable mm_events
To enable mm_events, set sysprop persist.mm_events.enabled=true from vendor
init.rc.
The following are in place to mitigate the memory and CPU footprint of mm_events:
- An
mm-events ftraceinstance uses a 4 KB buffer per CPU. - The
kmem_activitytrigger is rate-limited to once per minute. - Only 1
mm-eventstrace session can be active at any time.
Customization
mm_events uses a perfetto trace config file to specify which stats to capture
during the tracing session.
You can provide a custom Perfetto trace config in /vendor/etc/mm_events.cfg.
For a description of the available trace config fields, see the Perfetto
Docs.
For a sample trace configuration, see this
mm_events.cfg
example.
The important fields to include in your trace config to ensure it gets triggered by memory pressure are shown in the snippet:
# Ensures only 1 tracing session with this key can be active
unique_session_name: "perfetto_mm_events_session"

# If a trace with bugreport_score > 0 is running,
# the captured data is made available in the zipped bugreport
# at FS/data/misc/perfetto-traces/bugreport/systrace.pftrace
bugreport_score: 100

trigger_config {
  trigger_mode: START_TRACING
  trigger_timeout_ms: 3600000   # 1 hour
  triggers {
    # kmem_activity trigger gets activated when memory pressure
    # is detected
    name: "kmem_activity"
    stop_delay_ms: 360000       # 6 mins
  }
}
In this configuration mm_events initiates the perfetto kmem_activity trigger
and the Perfetto trace session begins capturing vm_stats and ftrace memory
events until the end of the configured stop_delay_ms period, 36000 ms (6 minutes).
The trigger timeout is set to a large value (in this case, 1 hour) and
mm_events config
is periodically rearmed to ensure that mm_events is always enabled. A bug report
gets generated as a result, containing the type of data shown in Figure 1
and Figure 2.
